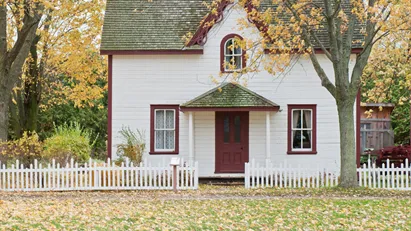
Hus i Oxie
Här hittar du 5 lediga hus att hyra i Oxie. Hyresbostad.se visar nya hus genom att övervaka bostadsmarknaden löpande och samla annonser från flera olika källor.
Nya hus upptäcks snabbt efter att de publiceras, så att du kan agera direkt och få en tydlig överblick över vad som finns tillgängligt just nu.
Hitta rätt bostad – guider, statistik och marknadsinsikt
Daglig marknadsrapport för hus att hyra i Oxie
Det finns 5 hus att hyra i Oxie idag. Utbudet av hus att hyra i Oxie har förändrats med 0 procent de senaste 7 dagarna och med −16,67 procent de senaste 30 dagarna. Den genomsnittliga hyran för hus att hyra i Oxie är 20 878 kronor, och det genomsnittliga kvadratmeterpriset är 110 kronor/m²/månad. Denna dagliga marknadsrapport baseras på Hyresbostad.se:s aktuella marknadsdata över hus att hyra i Oxie.
| 29 d sedan |
|
Ca. 195 m2 hus att hyra i Oxie, Ida Nilssons Gata
Ca. 195 m2 Rum 7
|
Ca. 20 000 kr.
|
Info |
| 1 mån sedan |
|
Ca. 110 m2 hus att hyra i Oxie, Glostorps Kyrkoväg
Ca. 110 m2 Rum 4
|
Ca. 15 000 kr.
|
Info |
| 1 mån sedan |
|
Ca. 290 m2 hus att hyra i Oxie, Rosentorpsvägen
Ca. 290 m2 Rum 6
|
Ca. 28 500 kr.
|
Info |
| 1 mån sedan |
|
Ca. 290 m2 hus att hyra i Oxie, Rosentorpsvägen
Ca. 290 m2 Rum 6
|
Ca. 30 000 kr.
|
Info |
| 2 mån sedan |
|
Ca. 55 m2 hus att hyra i Oxie, Krombyvägen
Ca. 55 m2 Rum 2
|
Ca. 11 000 kr.
|
Info |
Statistik över utvecklingen av lediga hus att hyra i Oxie under den senaste månaden
Nedan ser du utvecklingen av lediga hus att hyra i Oxie under den senaste månaden. I den första kolumnen ser du datumet. I den andra kolumnen ser du det samlade antalet hus att hyra i Oxie på datumet. I den tredje kolumnen ser du antal nya hus i Oxie som lagts ut för uthyrning på datumet. I den fjärde kolumnen ser du antal hus i Oxie som hyrts ut på datumet. Se även samlad statistik över alla lediga hus i Oxie över tid, samlad statistik över nya hus i Oxie över tid, samlad statistik över uthyrda hus i Oxie över tid
| Datum | Alla hus att hyra | Nya hus att hyra | Uthyrda hus |
|---|---|---|---|
| 3. juni 2026 | 5 | 0 | 0 |
| 2. juni 2026 | 5 | 0 | 0 |
| 1. juni 2026 | 5 | 0 | 0 |
| 31. maj 2026 | 5 | 0 | 0 |
| 30. maj 2026 | 5 | 0 | 0 |
| 29. maj 2026 | 5 | 0 | 0 |
| 28. maj 2026 | 5 | 0 | 0 |
| 27. maj 2026 | 5 | 0 | 0 |
| 26. maj 2026 | 5 | 0 | 0 |
| 25. maj 2026 | 5 | 0 | 0 |
| 24. maj 2026 | 5 | 0 | 0 |
| 23. maj 2026 | 5 | 0 | 0 |
| 22. maj 2026 | 5 | 0 | 0 |
| 21. maj 2026 | 5 | 0 | 0 |
| 20. maj 2026 | 5 | 0 | 0 |
| 19. maj 2026 | 5 | 0 | 0 |
| 18. maj 2026 | 5 | 0 | 0 |
| 17. maj 2026 | 5 | 0 | 0 |
| 16. maj 2026 | 5 | 0 | 0 |
| 15. maj 2026 | 5 | 0 | 0 |
| 14. maj 2026 | 5 | 0 | 0 |
| 13. maj 2026 | 5 | 0 | 0 |
| 12. maj 2026 | 5 | 0 | 0 |
| 11. maj 2026 | 5 | 0 | 0 |
| 10. maj 2026 | 5 | 0 | 0 |
| 8. maj 2026 | 5 | 0 | 0 |
| 7. maj 2026 | 5 | 0 | 0 |
| 6. maj 2026 | 5 | 1 | 2 |
| 5. maj 2026 | 6 | 0 | 0 |
| 4. maj 2026 | 6 | 1 | 0 |
Statistik över lediga hus i Oxie
I nedanstående tabell hittar du data om utbudet av hus att hyra i Oxie.Se också samlad statistik över alla lediga hus i Oxie över tid, samlad statistik över nya hus i Oxie över tid, samlad statistik över uthyrda hus i Oxie över tid
| Hus | |
|---|---|
| Antal lediga bostäder | 5 |
| Antal nya bostäder sedan igår | 0 |
| Antal uthyrda bostäder sedan igår | 0 |
| Lediga m2 totalt | 945 |